Teaching Environmental Justice
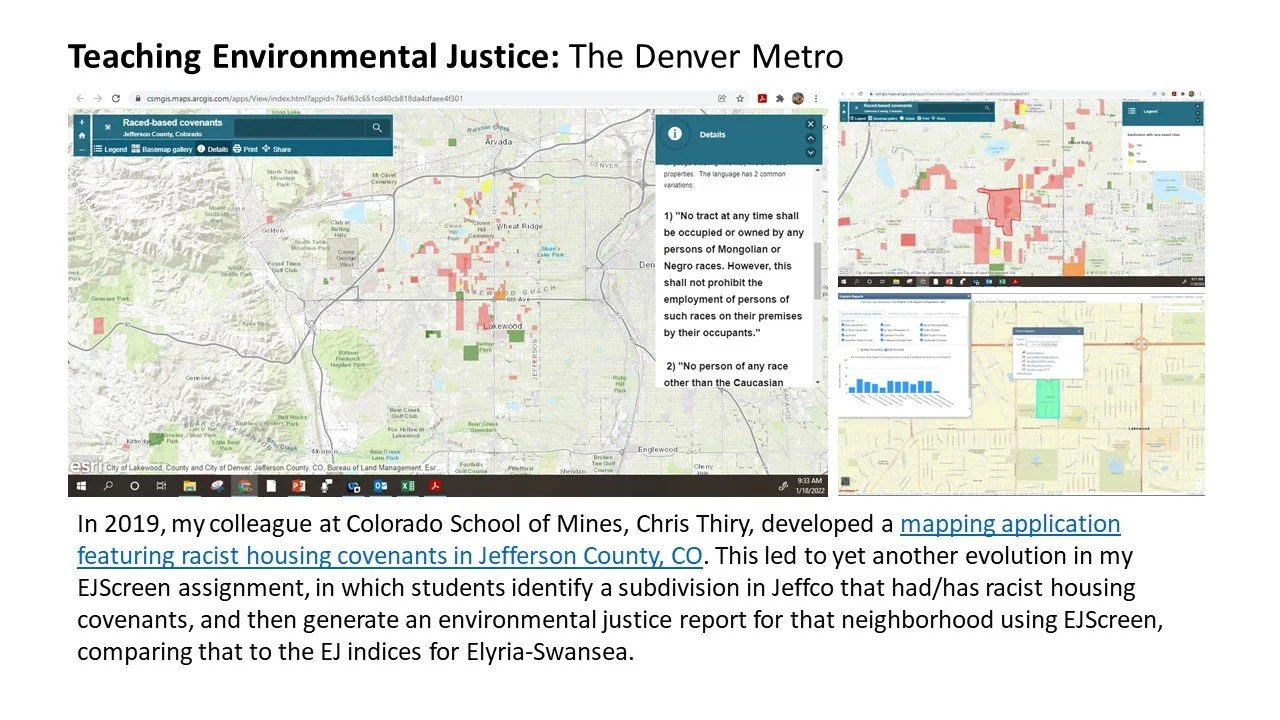
While teaching Intro to Human Geography at the University of Kansas in 2010, I heard of a new web-mapping application being beta-tested by the EPA called EJView, now EJScreen. I played around with it for all of about twenty minutes before realizing that this could revolutionize my teaching. I also saw then that Environmental Justice and Climate Change were going to be the two big themes that most of my teaching revolved around - these are the two areas of interest in the field of geography that have the most impact and appeal to students today, and areas in which geographers have long specialized due to our interdisciplinary and holistic nature. Additionally, I knew that being able teach and utilize geospatial technology in my own research would be a vital aspect of my own professional development, and marketable hard skills for my students to acquire. Since then, I have developed a number of assessments and lectures on these two topics, ranging from rigorous lab exercises on Urban Heat Island impacts on community of color, to technical comparative analyses on the impact of racist housing covenants in different neighborhoods in the Denver metro. I have delivered invited presentations on the topics of environmental justice, climate change, and public policy to a number of different audiences, from elementary schools to the Osher Lifelong Learning Institute (based out of the University of Denver). In 2023, I finally was able to present some of this pedagogy to my colleagues at the AAG in Denver after having that conference delayed by COVID-19 Pandemic in 2020.
AAG Denver 2023

Assessments
-
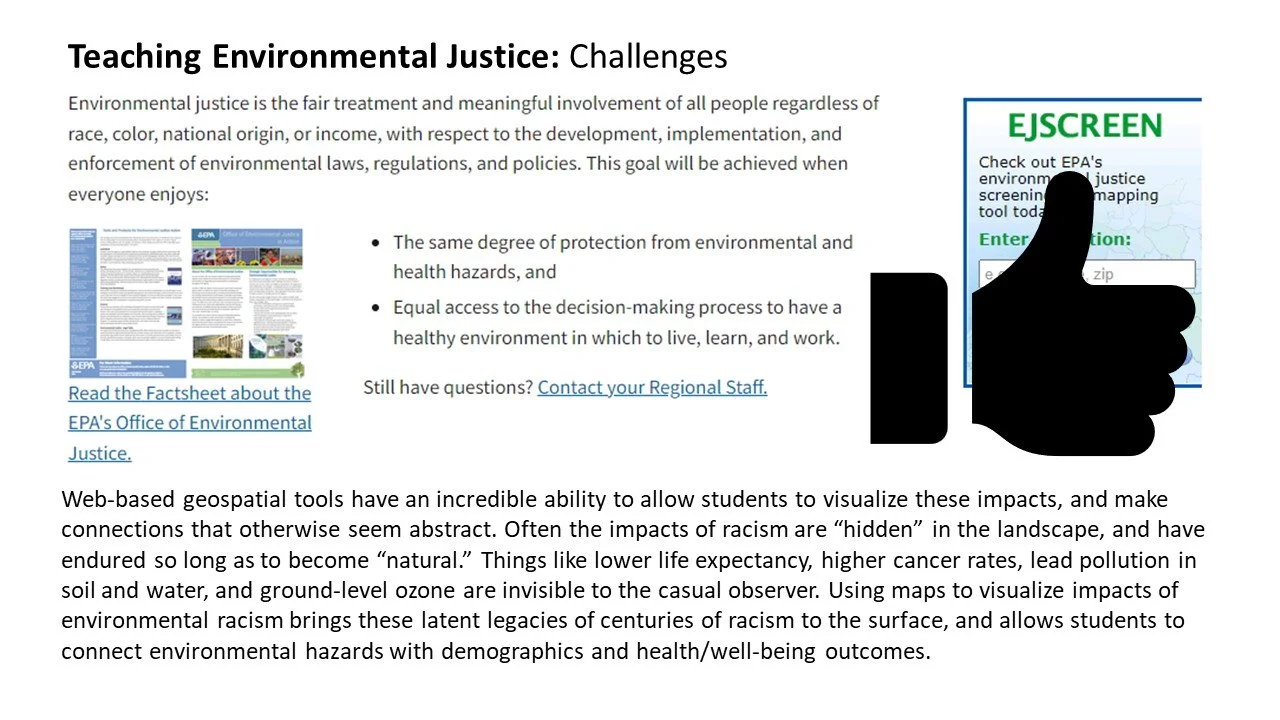
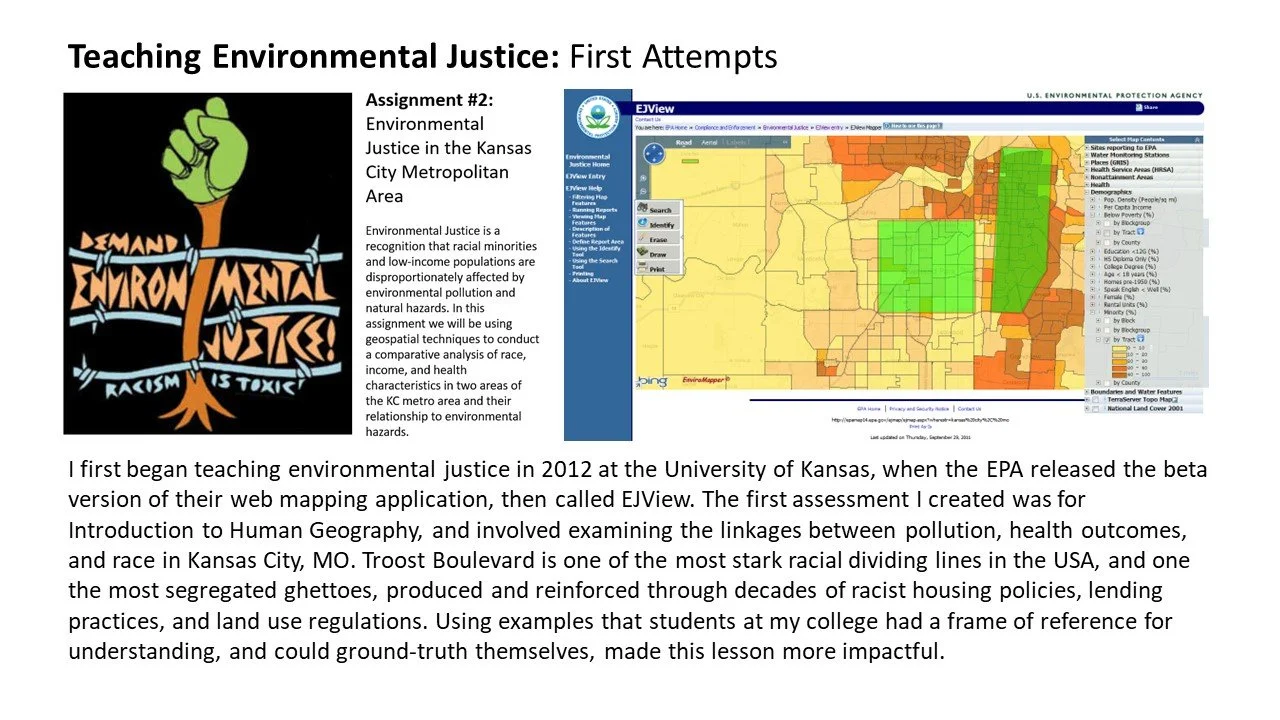
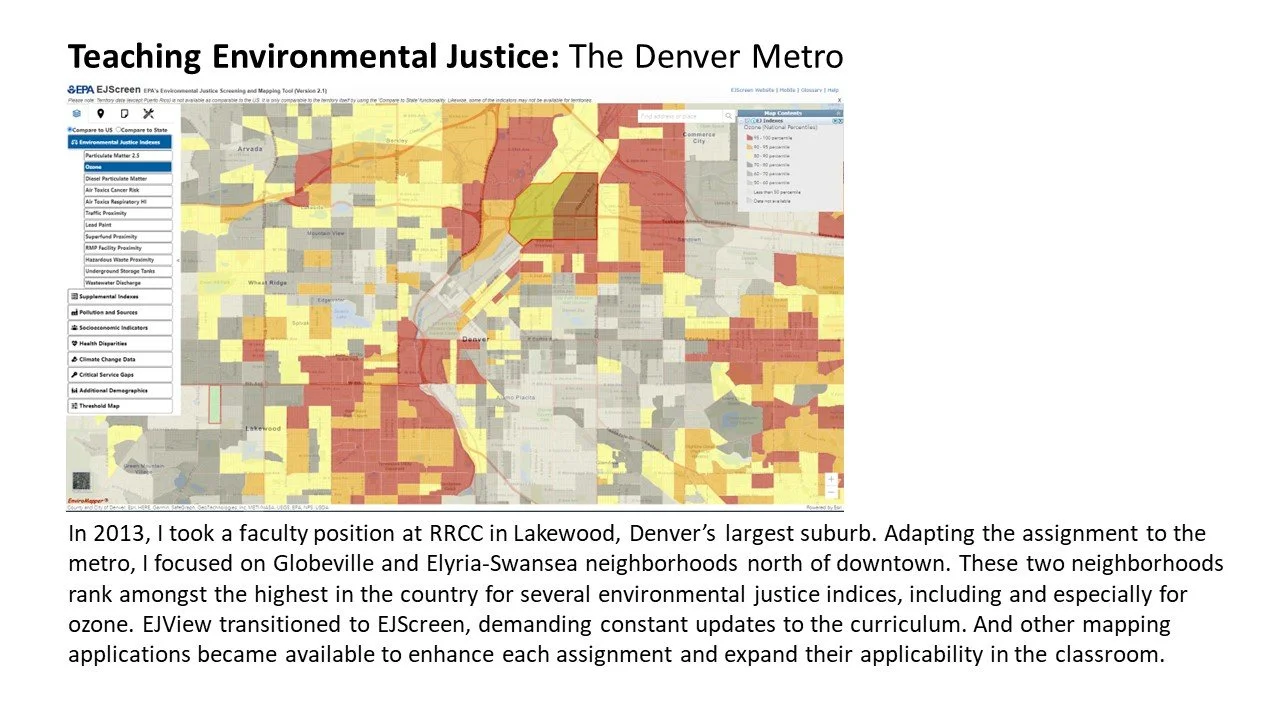
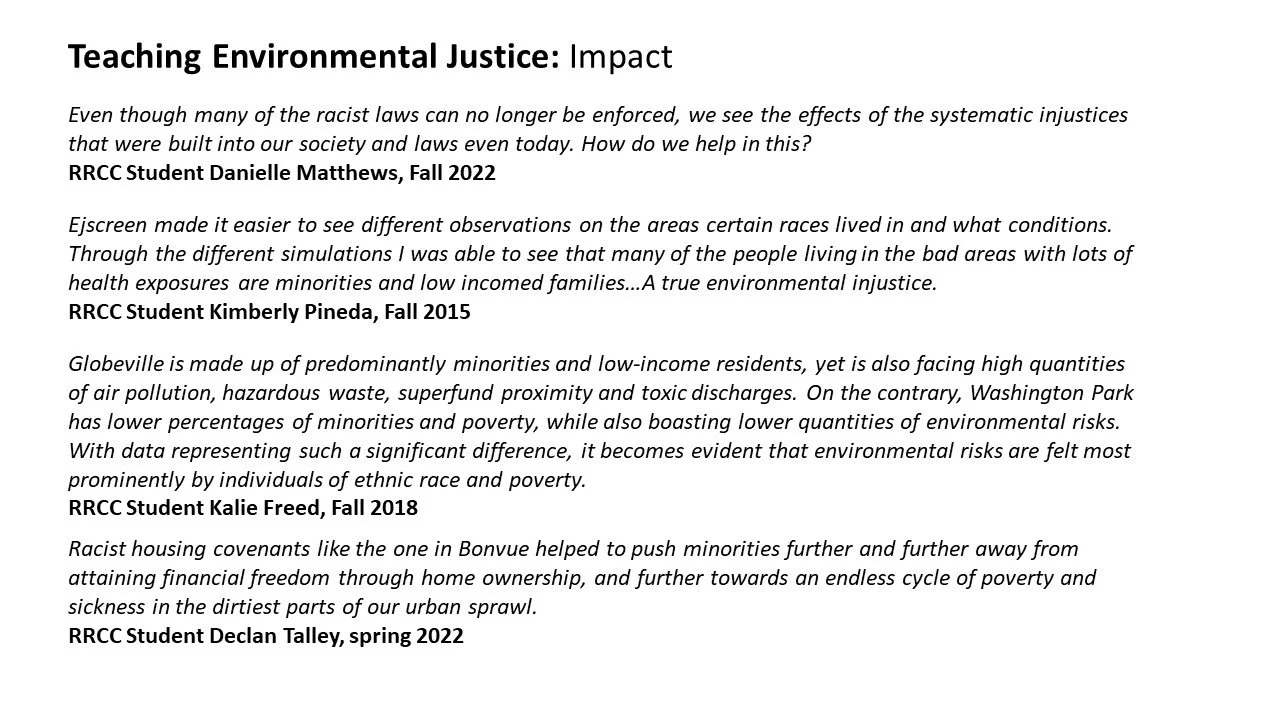
Environmental Justice is a recognition that racial minorities and low-income populations are disproportionately affected by environmental pollution and natural hazards. In this assignment we will be using geospatial techniques to conduct a comparative analysis of race, income, and health characteristics in two areas of the Denver metro and their relationship to environmental hazards.
-
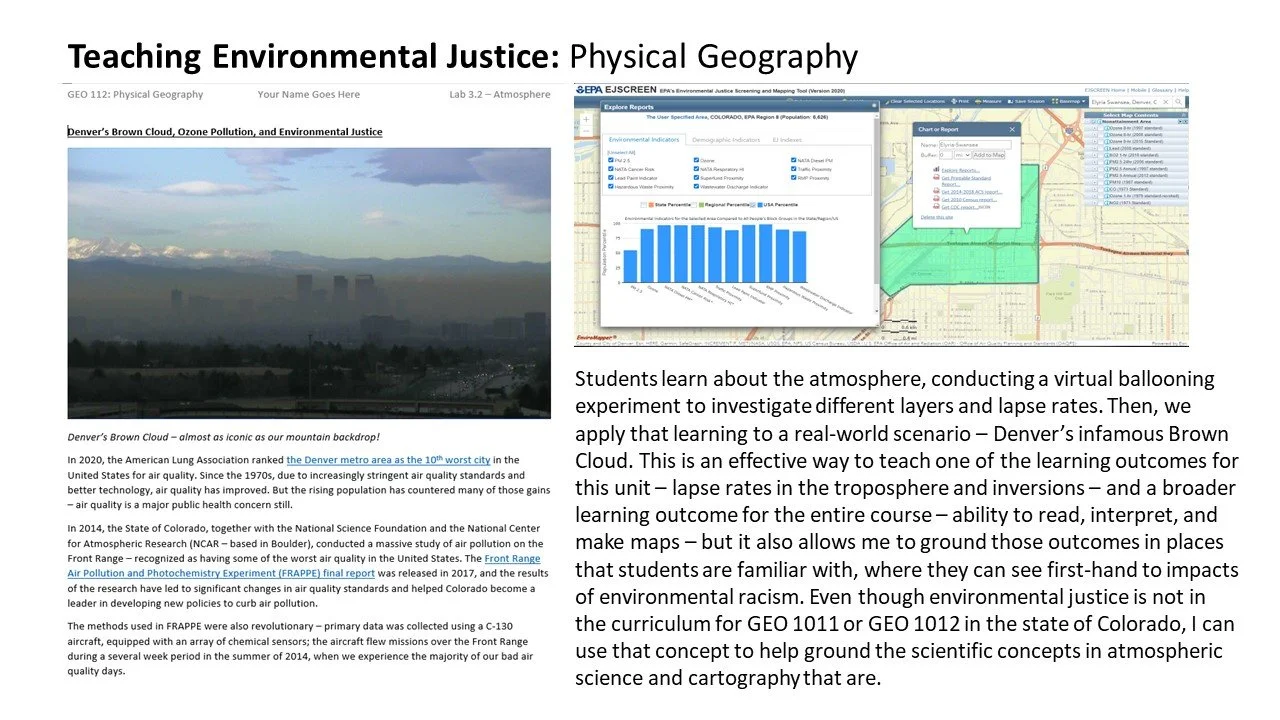
Understanding the geography of air pollution is vital to saving lives, and saving tax dollars in treating preventable diseases. It also makes a difference for businesses and average citizens – do you have an older car? Do you enjoy going to get your emissions checked every time you have to register your car? Did you know that people in other parts of the country, with better air quality, don’t have to go through that? The laws that require vehicle owners to get their vehicle emission systems inspected are in place because the Front Range is identified by the Environmental Protection Agency as a Non-Attainment Area. Non-Attainment means we regularly violate federal air quality standards, designed to protect our health and the environment. Non-attainment means state and local governments have to make efforts to cut air pollution – we are encouraged not mow our lawns, and to carpool, on ozone alert days; some businesses face fines and other penalties for not controlling ozone emissions. This is a big reason the busses in Denver now run on natural gas, or electricity, instead of diesel. Non-attainment also means that businesses and industries that want to move here face bigger costs and stricter environmental rules, so having bad air quality has wide-reaching impacts. But the most important consequence is the impact ozone has on human health. Let’s take a look at this human-environment relationship – how our geography, and ozone, collude to produce impacts on human bodies. Download this assignment.
-
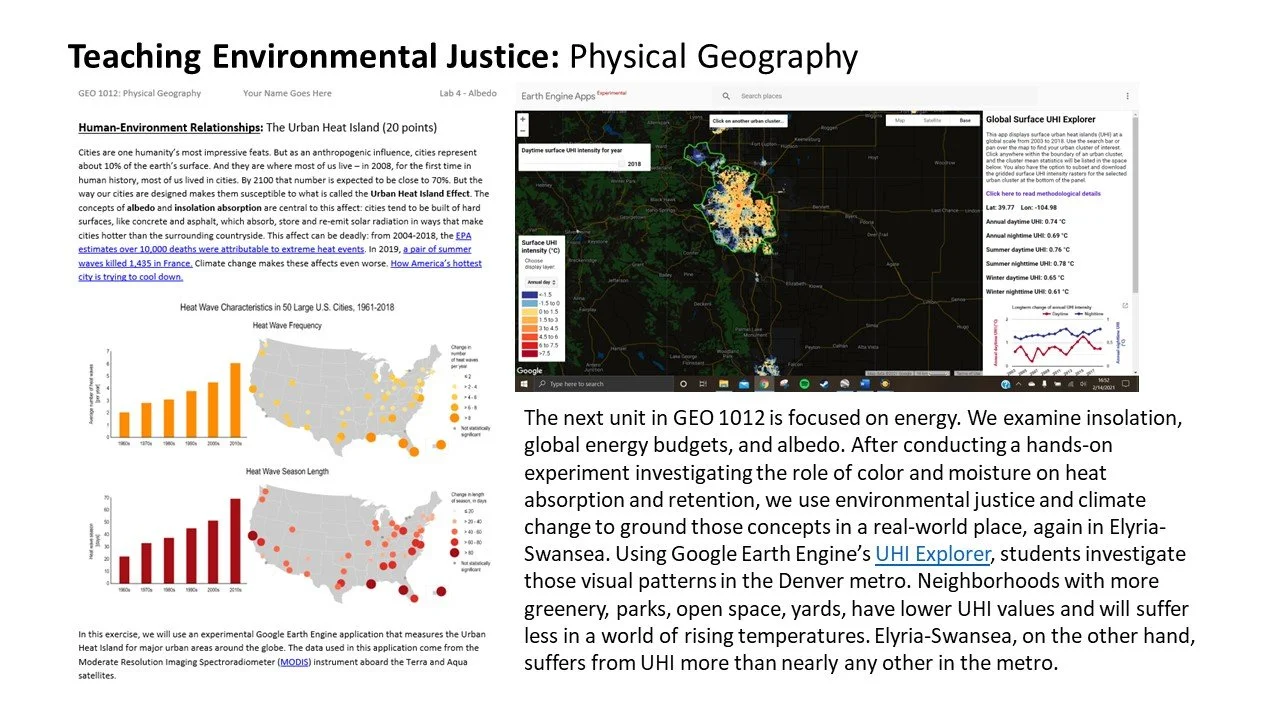
In this exercise, we will use an experimental Google Earth Engine application that measures the Urban Heat Island for major urban areas around the globe. The data used in this application come from the Moderate Resolution Imaging Spectroradiometer (MODIS) instrument aboard the Terra and Aqua satellites.
-
This is an exercise I developed for a course I taught in the spring of 2023 called Global Climate Change. It investigates the relationship between water resources, glaciers in particular, and climate change, with an emphasis on how that might impact populations and migration in the future. Several geospatial learning outcomes are explained, including satellite imagery analysis, observational data, sampling bias, and population projections. Assignment requires use of Google Earth Pro for Desktop.
A Note on Geospatial: I focus primarily on web-based mapping applications, especially Google Earth, and open-source geospatial, because ArcGIS is proprietary, and while it is the industry standard, in my career as an urban planner and environmental activist, that shit is expensive! (I’m also an anarchist, so working with ESRI always kinda made me feel ick…sorry). Learning free, open-source, governmental, non-profit, and web-based geospatial data sources and mapping applications are entry-level skills that are highly marketable, low-cost, and low-barrier. And, they can provide the building blocks for future education and training in more robust geospatial applications.


